
 30 C
Best Infographics
Elections 2026Others / Best Infographics
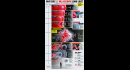
Time goes faster than some of us can even image. A lot can happen in just 1ms. This infographic serves as an example of what happens in 1.2ms, which is the amount of time it takes for a balloon to pop: The post What Does 1.2ms Look Like [Infographic] appeared first on Best Infographics .
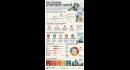
We hear about housing affordability issues in the US all the time these days. Unlike what some have suggested, it is not a hoax and is making it hard for people to buy or even rent quality places. This infographic from Rad Neurons takes a look the housing affordability squeeze: The post The Housing Affordability Crisis Visualized appeared first on Best Infographics .
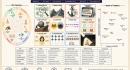
Many of us are guilty of being biased on certain topics without even knowing it. Cognitive biases can affect how we process information and judge reality. This infographic from Rad Neurons decodes 12 different cognitive biases: The post 12 Cognitive Biases Decoded [Infographic] appeared first on Best Infographics .