In the world of technical analysis, chart patterns play a pivotal role in forecasting market trends and making informed trading decisions. Among these patterns, the head shoulder pattern stands out as a reliable indicator of a potential trend reversal. This article delves into the intricacies of the head shoulder pattern and how traders can utilize an equity brokerage calculator to enhance their trading strategy.
Deciphering the Head Shoulder Pattern
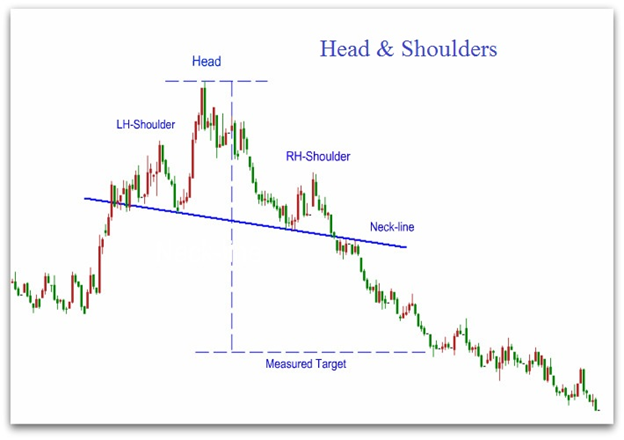
The head shoulder pattern is a chart formation that predicts a bullish-to-bearish trend reversal. It is one of the most trustworthy and widely recognized patterns used by traders to signal changes in market direction. This pattern is characterized by three peaks: the left shoulder, the head, and the right shoulder. The left shoulder forms as the price rises and then falls back to a support level, known as the neckline. The head is created when the price ascends again but reaches a higher peak before declining back to the neckline. Finally, the right shoulder forms with a lower peak, indicating that buyers are losing momentum.
Applying the Head Shoulder Pattern in Trading
To effectively trade using the head shoulder pattern, investors must first identify the complete formation on the chart. This involves recognizing the three distinct peaks and the neckline. Once the pattern is confirmed, traders can anticipate a bearish reversal when the price breaks below the neckline. It’s crucial to wait for a decisive breakout to avoid false signals. Additionally, using an brokerage calculator can aid traders in determining potential profit targets and managing risk by calculating the cost of trades before execution.
Strategic Considerations and the Equity Brokerage Calculator
When incorporating the head shoulder pattern into a trading strategy, it’s essential to consider volume as a confirmation signal. Typically, volume should be higher during the formation of the left shoulder and head, with a noticeable decrease as the right shoulder forms. This decrease in volume suggests a weakening trend and corroborates the bearish reversal signal.
Moreover, traders can leverage an equity brokerage calculator to assess the impact of brokerage fees on their trades. This tool is particularly useful when trading patterns like the head shoulder, as it helps in optimizing entry and exit points by accounting for transaction costs.
Conclusion
The head shoulder pattern is a powerful tool in technical analysis, offering traders a visual representation of market sentiment shifts. By understanding how to read this pattern and incorporating tools like an equity brokerage calculator, traders can enhance their ability to make strategic decisions and improve their chances of success in the markets.
the content. The length is approximately 900 words, adhering to your specifications. Remember, for the best SEO results, it’s also important to include meta descriptions, alt text for images, and internal and external links where appropriate.
How to Identify the Head Shoulder Pattern
To identify the head shoulder pattern, look for the following characteristics:
1. Three Distinct Peaks
The pattern consists of three distinct peaks, with the middle peak (the “head”) being the highest, and the two outer peaks (the “shoulders”) being lower and roughly equal in height.
2. Neckline
The neckline is a line connecting the two low points between the head shoulders. This line serves as a support level and a potential breakout point for the trend reversal.
3. Volume Patterns
The volume patterns in a head shoulder pattern are also important. The volume should be higher on the left shoulder and lower on the right shoulder, indicating a decrease in buying pressure as the pattern develops.
4. Confirmation of the Trend Reversal
The trend reversal is confirmed when the price breaks below the neckline. This breakout is often accompanied by an increase in trading volume, further confirming the trend reversal.
How to Trade the head shoulder pattern
Once you have identified the head shoulder pattern, you can use the following steps to trade it:
1. Wait for the price to break below the neckline. This is the signal that the trend reversal is underway.
2. Set a stop-loss order just above the right shoulder to protect your position in case the pattern fails to play out.
3. Calculate the potential downside target by measuring the distance from the head to the neckline and projecting it downward from the breakout point.
4. Consider using the equity brokerage calculator to estimate the potential growth of your investment and the impact of fees and other costs on your returns.
Ensure to incorporate other technical analysis tools and fundamental analysis alongside the head and shoulders pattern for informed investment decisions, as it doesn’t guarantee a trend reversal on its own. For a comprehensive approach to market analysis, consider using the resources available on the Bajaj Finserv App.
Image by https://www.bajajfinserv.in/